In our last post, we looked at using data to set your 2020 marketing budget. Now, we’ll look at what the data says about how to allocate that budget.
Like our last post, we’ll be combining data from several industry surveys, along with our own experience. Those surveys are Gartner’s “The Annual CMO Spend Survey 2019-2020,” Deloitte’s “The CMO Survey, August 2019” and Growth Marketing Stage’s “Marketing Budgets 2019-2020.”
Most Companies Evenly Split Their Spending Four Ways
As we commented in our last post, Gartner’s survey shows that most companies evenly split their overall marketing budgets four ways, across the categories of “Agency,” “Martech” (aka marketing technology and software), “Media” and “Labor” (aka internal staff time).
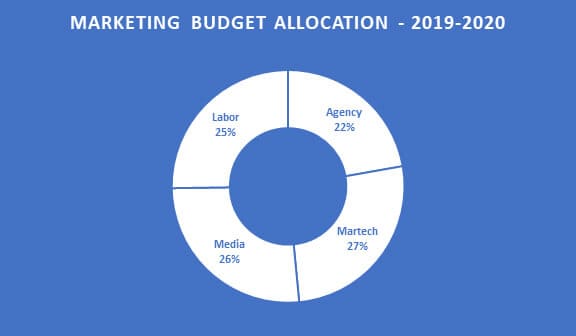
If you average out the reported data from the same survey over the past three years, you’ll come out even closer to a four-way tie.
So, imagine you’re the CMO for a $10 million company. Following our last post, you assessed that a reasonable spend for your specific needs is 15% of your revenue, giving you a $1.5 million overall marketing budget.
With this data, it might be reasonable to start your marketing budget allocation planning with an overall budget that falls into these four categories:

However, Gartner’s survey is made up of primarily very large companies, with nearly three-quarters of their respondents working for companies with over $1 billion in revenue. In our experience, that kind of investment in marketing technology doesn’t make sense for midsize and smaller businesses.
If we were advising a company with a $1.5 million total marketing budget, we’d suggest pushing their marketing technology budget to about 5%–10% of the overall budget, and distributing the rest across the other categories. That would give a starting point that looked more like this:

Digital Is Growing at the Expense of Traditional Media
It won’t come as a surprise to anyone that companies are spending more on digital and less on traditional media channels.
This year, Deloitte’s CMO survey reported that on average, companies expect digital spending to grow 11.8%, while traditional media spending fell 0.2% — numbers that are fairly consistent with previous years.
Paid, Earned and Owned Budget Allocation
Gartner’s data gives us the best look at how companies allocate budgets across paid, earned and owned channels.
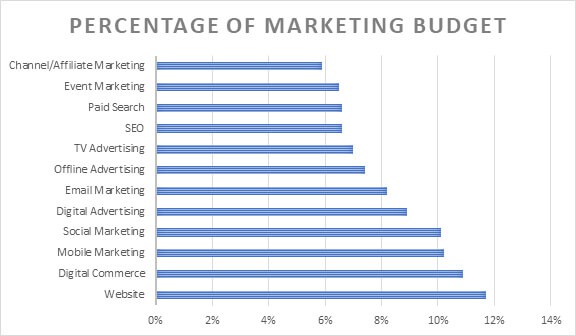
Because this data isn’t broken down by sector or industry, we wouldn’t say it’s enough to directly guide your allocation. However, it is reasonable to look at as a sort of gut check in your own internal allocation planning.
Say our hypothetical company from earlier was planning to spend about $200,000 of their annual $1.5 million marketing budget on their website. Would that be reasonable? According to this data, yes, that’d be completely reasonable — representing about 13% of their marketing budget, while the average company spends about 12%.
How Companies in Different Industries Allocate Paid Media Spend
Deloitte’s CMO survey gives some seriously in-depth information about how companies in different industries and market segments allocate their spending. Overall, spending across different categories of paid media looked like this:
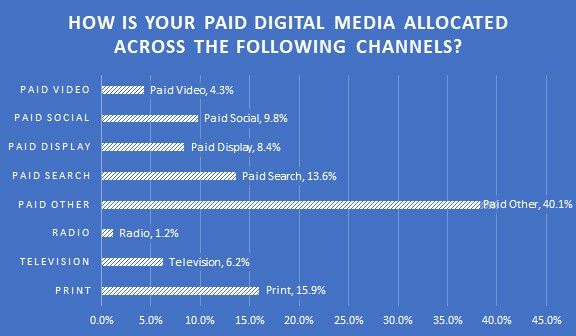
But, as you can imagine, that spending varied significantly by industry and economic sector.
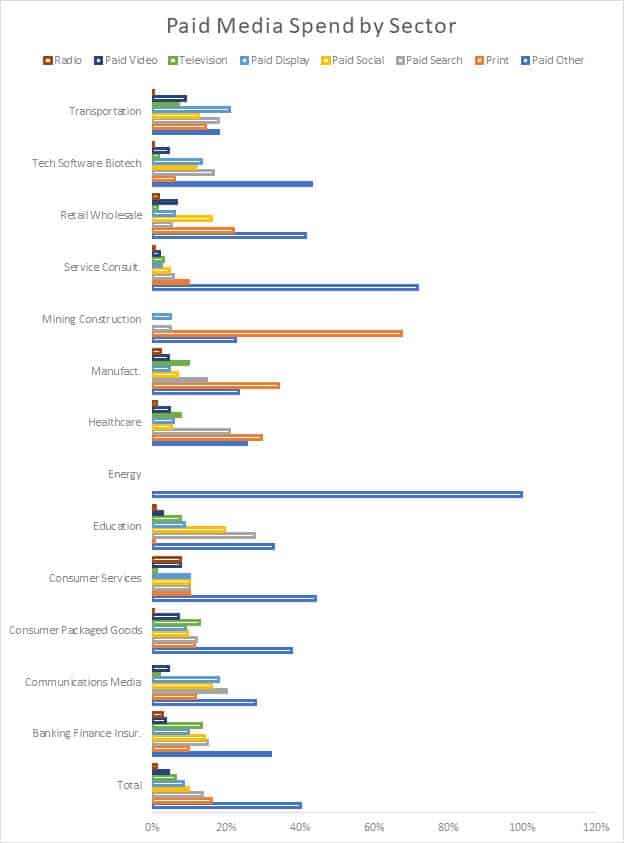
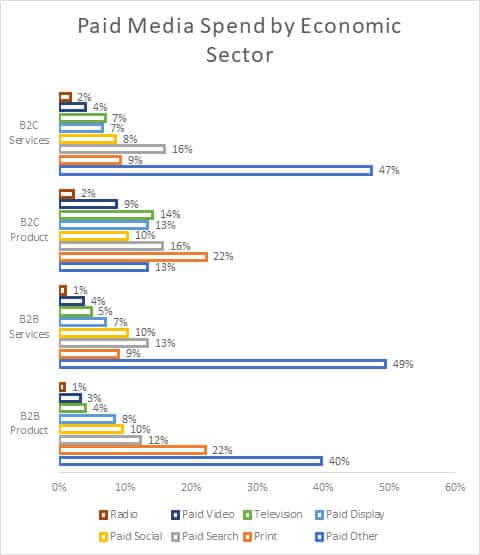
It’s also worth noting that when survey respondents were talking about “Paid Other,” they most commonly were referring to the categories of trade shows, sponsorships and direct mail.
If you’re using a data-based approach to allocate your marketing budget, you can find fairly representative data here for what other companies in your industry and sector are doing with their paid media budgets.
Events Are Still Big Business
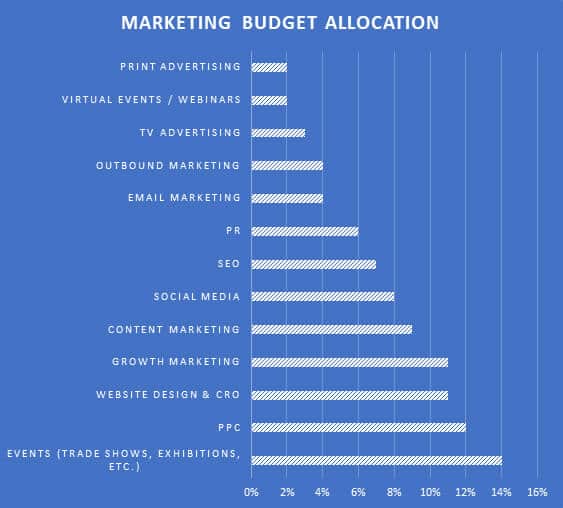
When it comes to offline channels, Growth Marketing Stage’s data suggests that events are still the number-one category of spending, outpacing all other channels in their survey. If we combine this data with the prevalence of “Paid Other” spending in Deloitte’s survey, we can reasonably assume that for B2B companies especially, events are well worth allocating marketing dollars to.
Where Companies Are Increasing and Decreasing Spend
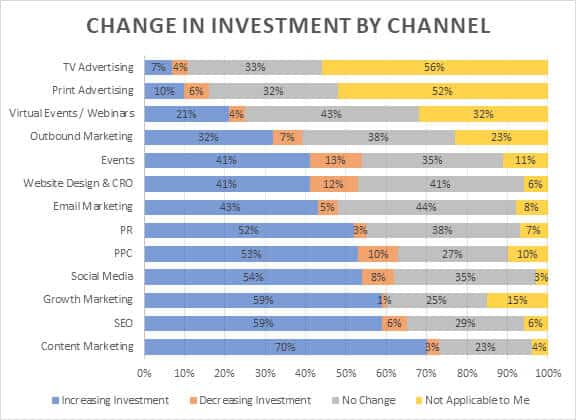
Helpfully, Growth Marketing Stage’s survey also looked at where companies are spending more and spending less. The big winners in terms of growth were content marketing, SEO and other digital channels.
Enough With External Data — What About Your Data?
All the data that we’ve been looking at so far tells you what other companies are doing. But remember: Doing exactly what other companies are doing, even companies in your segment and industry, isn’t a recipe for success. At best, it’s a helpful yardstick; at worst, it can blind you to your company’s needs and opportunities.
Set Goals
We talked about marketing goals in our budgeting post, and they’re as important as budget allocation. What are your goals, and which channels will let you most effectively reach those? Start there, and allocate your marketing budget toward the channels that most effectively support those goals.
Track & Optimize for ROI
We believe strongly in the importance of ROI. If you know what every channel is costing you and bringing you in terms of revenue, it’s suddenly very easy to decide where you should invest more and where you can cut back.
Now, some channels are relatively easy to get an accurate ROI from (think digital PPC ads), while others (say, branding) are much more difficult. Detailed ROI tracking can’t help you allocate your entire marketing budget, but it can certainly help you effectively allocate segments of that budget.
Build in Flexibility
Wherever you can, build flexibility into your budget allocations. None of us can see the future, and even experienced marketers are regularly surprised by the performance of certain segments, campaigns and outreach methods.
If your budget allocation is rigid, you’ll miss out on opportunities to react to those surprises. If it’s fluid, you can take advantage of them to improve performance throughout the year.
Putting It Together
Even the most data-driven approach to allocating ad budgets is a combination of an art and a science. There’s no way to plug numbers into a spreadsheet, run a series of formulas and come out with your company’s optimal ad budget. However, by starting with your marketing goals, adding the available data on what other companies are doing, bringing in your own data and then finishing it off with a healthy dose of your experience and intuition, you’ll be setting yourself up for as much success as possible.
And, if you’re ever looking for a bit of help, just let us know. We’d be more than happy to lend a hand.


